
Market Volatility News: Decode Trends Today
February 16, 2026
Understanding Options Market Volatility, News, and Trends
Ever feel like the stock market is having a mood swing? One day it’s calm, the next it’s all over the place. That feeling of uncertainty has a name: volatility. Grasping this concept is the key to understanding stock market volatility instead of just being confused by it. It’s also a common theme in options trading news.
While it seems complex, there’s a surprisingly simple way to measure the market’s collective anxiety. In practice, it relies on a financial tool that works a lot like hurricane insurance, giving us a clear signal of Wall Street’s current mood. This signal is at the heart of all options market volatility news, including options market volatility news today, and you can learn to decode it to interpret the market’s mood for yourself.
What Is Market Volatility? (Hint: It’s Not Just About Prices Falling)
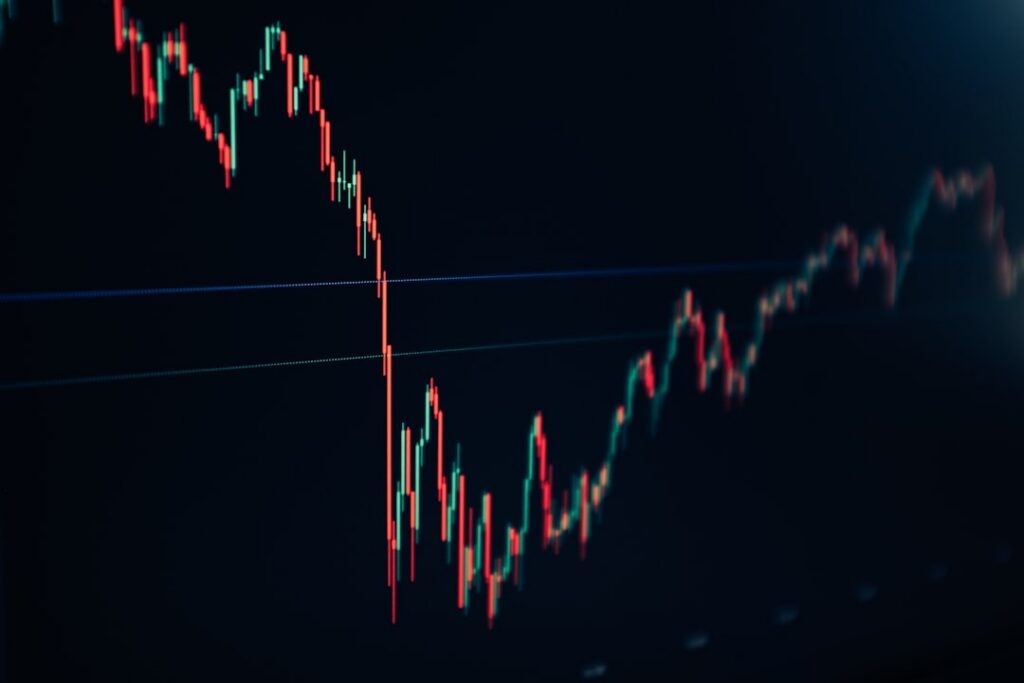
When you hear the term ‘market volatility,’ it’s easy to picture stock prices plummeting. While sharp drops are certainly a sign of it, that’s only half the story. The truth about volatility is less about direction and more about turbulence and day-to-day market fluctuations.
Think of it like a car ride. A low-volatility market is like cruising smoothly down the highway. In contrast, a high-volatility market is a bumpy, swerving journey where your speed is constantly changing. Volatility simply measures the size of the price swings—up or down—not just the losses.
Ultimately, when you see headlines about stock market volatility increasing, it’s a signal of widespread uncertainty. Investors are nervous and less sure about the future, causing more erratic price behavior. This collective anxiety is something big investors pay close attention to, and they have a fascinating way of trying to ‘insure’ themselves against it.
Why Options Are the Market’s “Hurricane Insurance”
Let’s start with a simple analogy: hurricane insurance. If you live in a calm, sunny region, your insurance premiums are relatively cheap. But if meteorologists predict a major storm is heading your way, the cost to insure your home skyrockets. Why? Because the perceived risk is suddenly much higher.
In the financial world, large investors use a similar tool to protect their massive portfolios. This tool is called an option. For them, buying an option can act like a form of ‘market insurance’ against a sudden downturn. This is a simplified view of using options to hedge against uncertainty.
This connection is exactly how market volatility affects options pricing. When these investors get nervous and expect a market ‘storm’ of high volatility, they rush to buy this insurance. Just like with real hurricanes, a surge in demand for protection drives up the price—or ‘premium’—of these options.
Therefore, the price of options becomes a powerful guide to options fear and greed indicators. By watching whether these prices are rising or falling, we get a direct, real-time reading of Wall Street’s collective anxiety. This very signal is what powers the market’s official “fear gauge.”
Meet the VIX: The Market’s Official “Fear Gauge”
So how do we track all this anxiety in one simple number? The answer is the CBOE Volatility Index, better known by its ticker symbol, VIX. This is the market’s official “Fear Gauge.” Instead of a vague feeling, the VIX synthesizes all that option “insurance” pricing into a single figure that tells us what the market expects volatility to look like over the next 30 days.
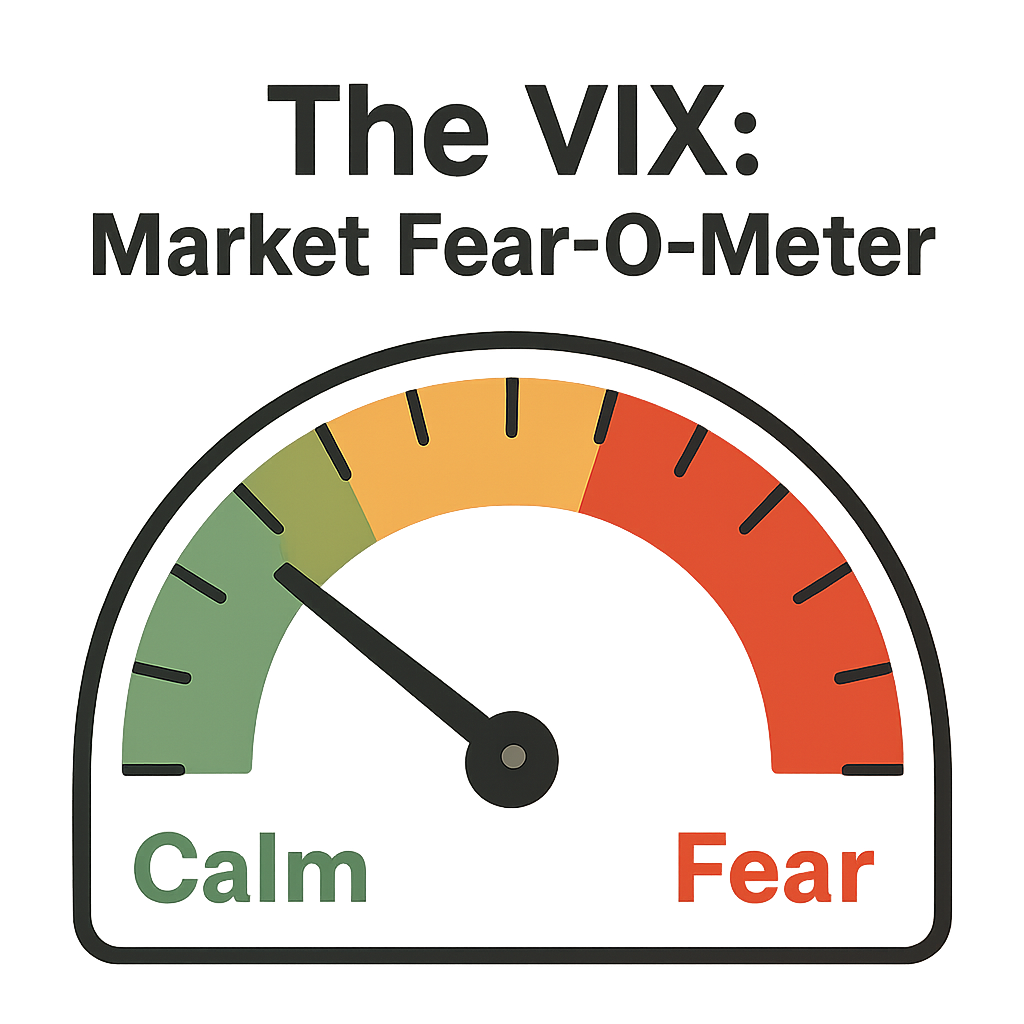
Think of the VIX like a speedometer for market fear. Generally, a reading below 20 suggests investors are feeling calm and complacent. As the number climbs above 30, however, it signals significant anxiety and a higher likelihood of dramatic price swings. Most of the time, the market hums along in that lower range, but when fear takes over, the needle can jump deep into the red zone.
This isn’t just theory; the VIX has a powerful track record. For instance, it saw historic spikes during the 2008 financial crisis and again in the market panic of March 2020. While expert traders use complex tools based on concepts like VIX futures and options explained elsewhere, for us, its value is simple. Seeing the VIX jump on the news is a clear sign that major events are rattling the market’s cage.
What News Events Trigger Market Volatility?
Now that you understand the VIX acts as the market’s “fear gauge,” you might wonder: what actually causes the needle to jump? The answer isn’t random market jitters; it’s almost always a reaction to real-world news that changes the outlook for the economy.
The single biggest driver is often the U.S. Federal Reserve. When “the Fed” announces changes to interest rates, it’s effectively adjusting the cost of borrowing money for the entire country. Higher rates can slow down business growth and consumer spending, making investors nervous and sending volatility up. It’s the one announcement that Wall Street holds its breath for.
Beyond the Fed, crucial economic reports also have a major impact. Data on inflation (the Consumer Price Index, or CPI) and employment can signal the health of the economy. Rapidly rising inflation, for instance, can erode company profits and scare investors, causing a spike in the VIX as they rush to buy “market insurance.” Finally, unexpected geopolitical events—from international conflicts to surprising election results—create pure uncertainty, and uncertainty is the primary fuel for volatility.
Key volatility triggers to watch for in the headlines include:
- Federal Reserve Interest Rate Decisions
- Inflation Reports (The Consumer Price Index or CPI)
- Major Geopolitical Events
From Confused to Confident: How to Read the Market’s Mood
Before, hearing a reporter mention “market volatility” or the “VIX index” might have felt like listening to a foreign language; now, you have the decoder. You’ve moved from being a passive listener to an informed observer, capable of understanding the emotional temperature of the market.
You now possess a simple but powerful mental model for what drives this. Concerning economic news can create investor fear. This fear increases the demand for “market insurance” through options, and that collective rush for protection is what makes the VIX number climb.
The next time you see a headline about a spike in the VIX, you won’t need to wonder or worry. You’ll simply recognize it as a measurement of Wall Street’s anxiety. This knowledge is for understanding the world with more clarity—not for making panicked decisions about your long-term savings.
Worried about volatility and what it means for your retirement plan?
Schedule a free, no-obligation consultation, and we’ll help you review your current strategy, stress-test your plan for market swings, and outline practical next steps—so you can stay focused on long-term goals instead of short-term headlines.